How do your PPC campaigns compare to industry paid search benchmarks?
One of the most common questions we get from our clients is, “How does my campaign’s performance compare to the industry average?” This is not always easy to answer. Every search campaign is unique with different key performance indicators (KPI’s), goals, and a variety of ways to measure success.
However, it is good to know industry averages so you have a frame of reference with which to measure success. Knowing your industry benchmark can help you set realistic expectations for paid search, understand when your campaign is in trouble, and appreciate when you’re doing better than average so that you can, perhaps, allocate more of your media budget to paid search.
I want to caveat these stats by saying that even if your campaign appears to be doing far worse than average (or far better), the bottom line metric should be return on ad spend. A high clickthrough rate and low cost per acquisition doesn’t mean much If your campaign isn’t making you money.
In Q2 2015, Wordstream reviewed data for over 2300 of their US-based clients across all verticals, representing a $34.4 million AdWords spend. Here are the top line averages for Google’s search network versus the Google display network (GDN) for the four most common metrics:
All Industries
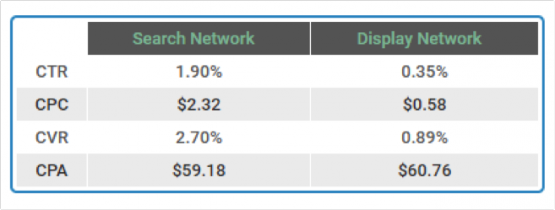
* CTR = Clickthrough Rate | CPC = Cost Per Click | CVR = Conversion Rate | CPA = Cost Per Action
These numbers should only be used as a broad measure of performance success (or failure) since there is a lot of variation across industries. Top line metrics such as CTR and CVR are relative since, with some exceptions, the ultimate measure of performance success should be return on investment (ROI) or return on ad spend (ROAS).
Here’s the breakdown of key metrics by industry.
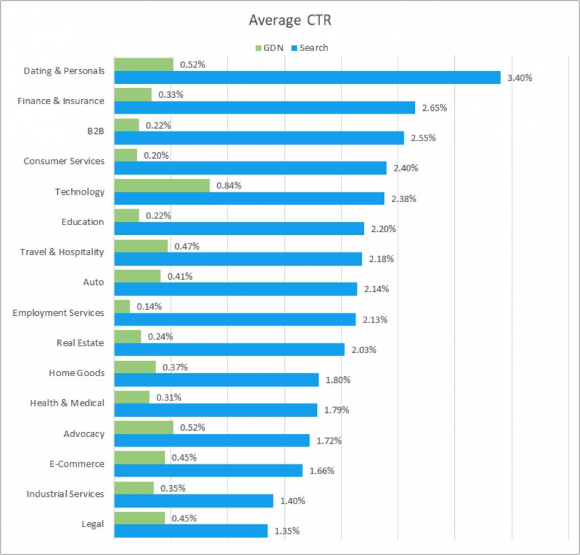
Legal has the lowest CTR at 1.35% in the search category while Dating & Personals has the highest at 3.4%. It is interesting to note that Technology has the highest GDN CTR at 0.84% which is 140% above the average across industries of 0.35%. This represents an opportunity for technology advertisers to capitalize on the lower CPCs in their industry (the average CPC is $0.20 for the technology category on display).
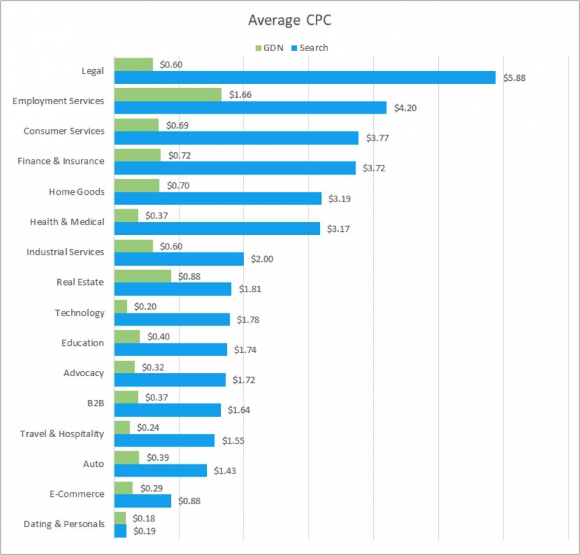
The most competitive industries have the highest CPCs, with legal and employment services topping all other industries on the search network. Even within these industries, CPCs can fluctuate widely with the top terms costing much more than the average CPC (e.g., the term “lawyer” has an average CPC of $42.51 and ranks as the 6th most expensive term to bid on).
Display CPCs are almost always lower than $1.00 with the exception of the Employment Services category. It’s important to be aware of CPCs for display even though they seem to cost less because the volume can often be much higher than the search. The fastest way to drain your PPC budget is to set display bids and corresponding campaign budgets too high and let them run without frequent optimization and review.
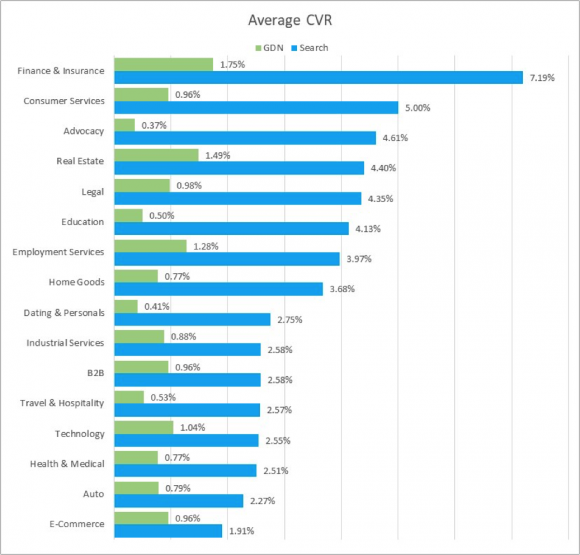
Conversion Rate (CVR) is an excellent metric to track when fine tuning your campaign. It can also help you take the temperature of your campaign’s performance when you are just starting out with paid search. If you are in Real Estate, for example, and your conversion rates are less than 4% for search and 1% for display, it may be time to evaluate your strategy.
We often tell clients that the best way to move the needle in terms of campaign success, is not through a blind focus on keyword and ad copy optimization (though of course, this is important too), but by testing landing page design, layout, and strategy. If your conversion rates consistently fall well below the above-listed industry averages, it may be time to take a step back and evaluate your competitors’ strategies and your own landing page goals. For example, if you have a complex or high-priced service (e.g., a $4000 webinar), then expecting people to convert directly from a search ad may be unrealistic. Instead, consider offering a free whitepaper download or pushing users to chat with an online customer service rep or call a toll-free number.
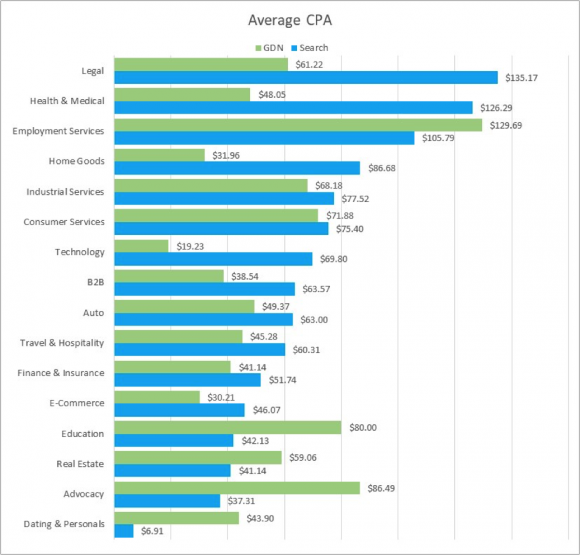
It is not surprising that the industries with the highest Cost Per Action tend to be the same industries with the highest CPC (namely: Legal, Employment Services, Home Goods, and Health and Medical). As a general rule, these industries have products or services on the higher end of the value scale. There are exceptions, of course. CPCs for the Dating & Personals category average below $0.20 for both search and display, but the CPA for search in this category is over $40. This may be a factor of high competition in the industry as well as a few top brands dominating the ad marketplace.
As with all metrics, CPA is relative. A CPA that exceeds $100 may be quite reasonable to a lawyer whose average value per new client is in the thousands (or tens of thousands) of dollars. Likewise, a “low” CPA of $19 (for Technology display) may not be a great value if the average value of a new customer is $25.
One final note—it’s important to compare all top-line metrics and KPIs against other media. This is the best way to plan your marketing strategy for the coming quarter or year. If the search has a CPA of $140 but offline media (radio, billboards, magazine ads, TV) have a much higher CPA, then this should factor into your budget plan for the coming year.
Read more about some of our marketing budget insights here.
Share this